|
|||||
|
|||||
|
|||||
|
|||||
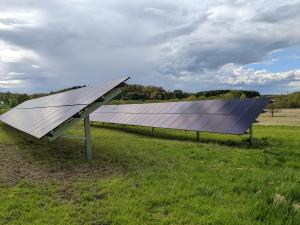
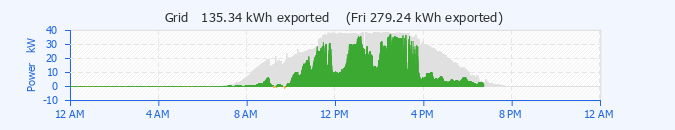
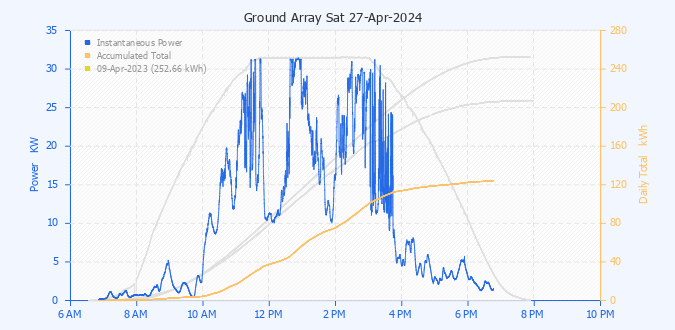
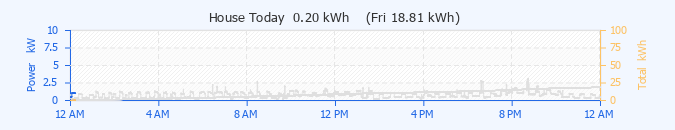
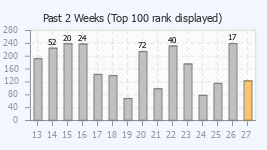
Location This site is located 25 miles due north of Pittsburgh PA at about 40.75 degrees N latitude. Installation This is the second location that we have owned/operated. The first array (20KW) at our prior residence about 40 miles SE of here served us flawlessly for 10 years and generated nearly 1/4 gigawatt. These systems were installed by EIS Energy Independent Solutions Pittsburgh, PA. This solar installation operates at nearly the maximum allowed for residential net metering. It was installed in two phases. The first stage was installed in 2021 and consist of a grid connected 36KW ground mounted array. The second installation was completed in 2023 utilizing a Tesla PowerWall system supported by its own 10KW of roof-mounted panels and 42 kWh in battery capacity. This new system serves as a battery backup for the residence and does export excess solar when it is available. 36KW Ground Mounted Array The ground mounted system is preferred because it not only allows the array to be optimally positioned and more easily serviced, it allows the panels to run cooler and therefore more efficiently; This avoids the issue with maintaining or replacing the roof on the residence; And, it also does not put the home at risk due to fire resulting from any fault of the high powered electrical systems involved. Panels are fixed at a 30-degree angle and aimed due South. While additional power may be gained by tracking the Sun, any mechanical movement would involve additional hardware and present an ongoing maintenance concern. If more power is desired the preferred solution is to add more panels. If anything could be done to improve performance it would be to add some form of passive cooling. The lower the temperature the more efficient the panels become and the more power will be generated. This system uses 100 Heliene 360W panels connected to 4 SMA SunnyBoy 7.7-US-41 grid connected inverters. 10KW Tesla PowerWall System This system deploys 10KW of roof-mounted panels. While not considered ideal the barn roof presented as an obvious location for these panels. Concerns regarding roof maintenance are minimal given that the roofing had been replaced earlier in the installation year. Roofing issues themselves are less of a concern given that this is located on a BARN. And, because it is a barn the risk of fire from electrical malfunction (arc faults) is a bit less concerning. A Tesla PW+ and two Tesla PW2 couple to provide 42 kWh of backup battery power and 100A of electrical service for the home. When fully charged this system can operate the home off-grid for two days in the absence of solar charging. Potentially, even when solar conditions are poor, this system could maintain off-grid operation for very long periods of time. Air-conditioning consumes a significant amount of power. If it should become necessary to run off-grid and in the absence of utility power for any lengthy duration, the air-conditioning could turned off. The PowerWall is configured to run in self-powered mode from 6PM until 9AM. That is to say that from dusk to dawn the system is allowed to power the home from the batteries. This then minimizes the purchase of power from the utility. During the day when solar is active the system serves only as backup and is instructed to focus on battery charging. Once fully charged any excess solar energy is exported to the grid. During this time the ground mounted array is also exporting. The net effect is that generally the property only exports power. Data Monitoring The energy status of the system is monitored every 10 seconds by an INTEG Model 410 JNIOR. This device collects inverter status through network connection and the MODBUS protocol. It reads the residence and battery system status from EKM meters using an RS-485 connection. The resulting data is made available on-demand through the JNIOR web server as a single JSON packet. A Ubuntu Linux based server in the residence collects data from the JNIOR every 10 seconds. This information is stored in a MySQL database. The Apache2 web server then presents the dynamic page that you are now viewing. Our database contains over 10 years of similar data from the prior solar plant. NOTE: NOT ALL DATA PRESENTED HERE (SUCH AS THE TOP 100 LISTING) INCLUDES THE CONTRIBUTION OF THE NEW POWERWALL SYSTEM. THIS WILL BE RECTIFIED AS WE GAIN EXPERIENCE WITH THE ADDITIONAL EQUIPMENT. Battery Levels As the ability to communication with the Tesla PowerWall is hampered (irritatingly by Tesla) the system power output is monitored by separate EKM meter. The battery percentage displayed is estimated by applying a ratio to the ground mounted system output providing the solar input estimate which is then offset by any power being delivered by the Tesla system. The battery level simulation tracks that reported by Tesla (on their app) fairly well. Power (W) The instantaneous amount of power in Watts (W) being generated by the array at this moment in time. This varies dramatically as to the quality of sunlight, angle of the Sun and the amount of cloud cover. Panels may even be covered with snow during winter months. Daily yield (kWh) The total amount of power in kilowatt hours produced during the current day. This resets to 0.00 at midnight. Our daily goal here is to more than cover the power used by the residence in the prior day. Hopefully we can consistently do so through most weather conditions and throughout the winter months. Total yield (kWh) The total amount of power generated by the array over all time in kilowatt hours. Grid status Indicates how much power the property has exported (credit) or imported (consumed) over all time. Grid status started at 0 on May 25, 2022 prior to solar operation but after installation. This might have been initialized with the total power ever used by the property over the past 20 years if that number were known. The total power used by the residence is deducted from that generated by the array in calculating the Grid status. Currently the power company (West Penn Power) accounts for incoming (nighttime) and outgoing (daytime) power accumulating a bank of kilowatt hours through the year. When the exported power exceeds that used during the billing cycle only the company's monthly delivery and line charges apply (typically less than $8) and are deducted from any dollar credit on the account. Banked kilowatt hours are converted to dollars annually around June. A dollar credit builds on the account and may be reimbursed. Averages The reported 'Daily Average' is the average power generated for full days of operation excluding any early testing and excluding the current day. The average for days in the 'Past 2 Weeks' excluding the current day is also reported. The difference can be used to establish any current trend. This should tend to follow the annual pattern of the amount of available daily sunlight as we travel from solstice to solstice. Top 100 This displays the top 100 production days (once we have operated for 100 days) in order from our record day down. Days within the past 2 weeks are highlighted. This list is dynamically updated as a day's performance might move up the list. Note that records are set on exceptionally clear days with the Sun high in the sky and during cooler temperatures. This typically occurs during late April and May. Temperature dramatically affects panel efficiency. During hot summer months we may not reach maximum power capabilities. This is one reason why a roof mounted system is less desirable. This 36KW array is ground mounted and located so as to allow both optimum sun exposure and to make good use of the prevailing winds for cooling. Off Record Pace At any given moment during the day the total power generated by the array is reported. The 'Off Record Pace' shows the difference between the power generated today and that of the best performance day, our record day, in kWh at the same point in the day. The record day, Top 100 #1 day, is shown ghosted in the above chart. A positive (+) value indicates that today is ahead of the record pace and barring cloud cover is making a run at the record. More typically this value will be negative (-) providing a feeling as to where the day might end up in the Top 100 table. Charting The larger chart graphs the instantaneous power (left scale) and the total daily power (right scale) during the key portion of the day. The record production day is shown as a ghost in the background. The current power used by the residence (house) is charted below the main chart. The ghosted data in this chart represents the prior day. Cloud Effects On a perfectly clear day with a beautiful blue sky, a smooth bell curve shape power curve is expected. This begins at sunrise and continues until sunset barring any shade from hills and trees at the horizons. The performance is highly dependent on the time of year depending on sun angle and duration of the day. It is also very dependent on temperature. It is not surprising that our best production occurs in the spring when the daylight lengthens but the temperatures have yet to give up the winter chill. Clouds block the sunlight and impact solar production. On a partly cloudy day the clouds line up and pass in sequence in front of the bright Sun causing great variation in the solar curve. This can often create quite a bit of "coloring" in our curve above. On an overcast day the solar power levels are (sadly) more consistently down. Of interest is that sunlight on a cloudy day can reach the panels by indirect routes and actually augment power generation. The sunlight can be more focused onto our array through reflection from nearby clouds and by general bending of the light through the moisture suspended high in the sky. This can be referred to as cloud lensing. The result is quite evident in our curves as power pushes above the blue sky bell curve. In fact this often pushes the inverters to their 31.4KW maximum allowable power output. There is a warning evident in the curve of a oncoming cloud as it first pushes power levels up with reflected sunlight before getting in the way dropping power. Is it possible that our ultimate Top 100 #1 record might come about on a cloudy day where, luck might have it, all of the clouds run north and south of the Sun's path providing power enhancing reflections but never blocking? |
 |
||||||||||||||||||||||||||||||||||||||||||||||||||||||||||||||||||||||||||||||||||||||||||||||||||||||||||||||||||||||||||||||||||||||||||||||||||||||||||||||||||||||||||||||||||||||||||||||||||||||||||||||||||||||||||||||||||||||||||||||||||||||||||||||||||||||||||||||||||||||||||||||||||||||||||||
|
Top 100
|
||||||||||||||||||||||||||||||||||||||||||||||||||||||||||||||||||||||||||||||||||||||||||||||||||||||||||||||||||||||||||||||||||||||||||||||||||||||||||||||||||||||||||||||||||||||||||||||||||||||||||||||||||||||||||||||||||||||||||||||||||||||||||||||||||||||||||||||||||||||||||||||||||||||||||||